
Last week, a glacier in the Himalayas collapsed, sending a torrent of rock and water into Nepal and China. The devastation left at least 800 dead, with thousands more missing.
The bitter irony is that such disasters tend to have a positive effect on GDP, since gross domestic product measures economic flow rather than substance. So when resources are mobilized to clear rubble and rebuild homes that’s positive for our main measure of the economy.
That’s not a quirk. It’s the way the tool was designed when it was created nearly a hundred years ago to understand the impact of the Great Depression. Even then, it was clear it was imperfect. Simon Kuznets, the godfather of GDP, warned of the deficiencies of the measure he created.
“Economic welfare cannot be adequately measured unless the personal distribution of income is known,” he wrote in his report to the U.S. Congress that introduced the concept in 1934. “The welfare of a nation can, therefore, scarcely be inferred from a measurement of national income.”

GDP still became the global standard for measuring economic success at the Bretton Woods conference in 1944. And in the 1960s, Kuznets again tried to warn about the shortcomings of his creation, writing:
“Distinctions must be kept in mind between quantity and quality of growth, between its costs and return, and between the short and the long term. Goals for more growth should specify more growth of what and for what.”
Despite all of the problems, we are still in the throes of what economist Joseph Stiglitz has called “GDP fetishism.” The number determines who wins or loses elections and stokes anxiety if a recession is declared because of it.
When policy focuses on the size of the pie, it doesn’t matter if 90% goes to the top 10%, while focusing on activity ignores the destruction of the natural world and people spending more for the same things (i.e., inflation). It is a quantity over quality metric.
GDP counts spending. It doesn’t care whether that’s building something new or calling in bulldozers to tear something down. A dollar spent on a wedding and a dollar spent on a divorce lawyer are identical. In other words, GDP “measures everything…except that which makes life worthwhile,” Robert Kennedy said in a campaign speech in Kansas in 1968.
Other catastrophes have clearly demonstrated these shortcomings. In July 2021, the Ahr Valley in western Germany was hit by the deadliest flood in the country’s postwar history, killing more than 180 people. Federal and state authorities responded by committing €30 billion for reconstruction, nearly completely offsetting the estimated damage of between €33 and €40 billion.
After Hurricane Katrina hit the U.S. Gulf Coast in 2005, there was an initial dip from the impact and then a rebound as reconstruction spending flowed into official statistics. At the time, the Congressional Budget Office projected that U.S. growth would not just recover but rise above the pre-storm trend because of the rebuilding activity.
But that benefit isn’t evenly distributed and only available in countries wealthy enough to have public resources to mobilize, according to a 2025 IMF working paper. That means in the Himalayas, the impact on Nepal will most certainly be deeper and last longer than across the border in China. But no matter what, the scale of loss and destruction can’t be fully reflected in accounting for economic activity.
We’re at a stage of development, where we can no longer ignore these deficiencies. Otherwise, the foundations for shared prosperity will be washed away — be it in a flood or through steady erosion taking place while we’re busy looking at the wrong scoreboard.
Changing the scoreboard
Economists have spent decades building alternatives. None of them is perfect, and none are as simple as GDP. But complexity isn’t a real argument in light of the scope and scale of the challenges we face.
So here’s a look at the leading contenders:
Genuine Progress Indicator
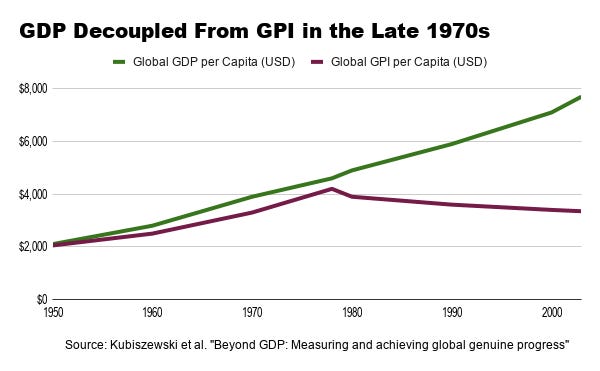
GPI uses the same personal consumption data as GDP, then adjusts it. It adds the unpaid value of household and volunteer work and subtracts the costs of crime, pollution and income inequality. Global GPI estimates suggest economic welfare has been roughly flat or declining since the late 1970s, in contrast to GDP’s ongoing growth. That more closely tracks how many people feel.
Pros: Since it’s in dollar terms, it’s legible to policymakers and comparable to GDP.
Cons: Some components (like the cost of income inequality) are inherently judgment calls, and it remains a work in progress rather than a fully standardized global metric.
Human Development Index
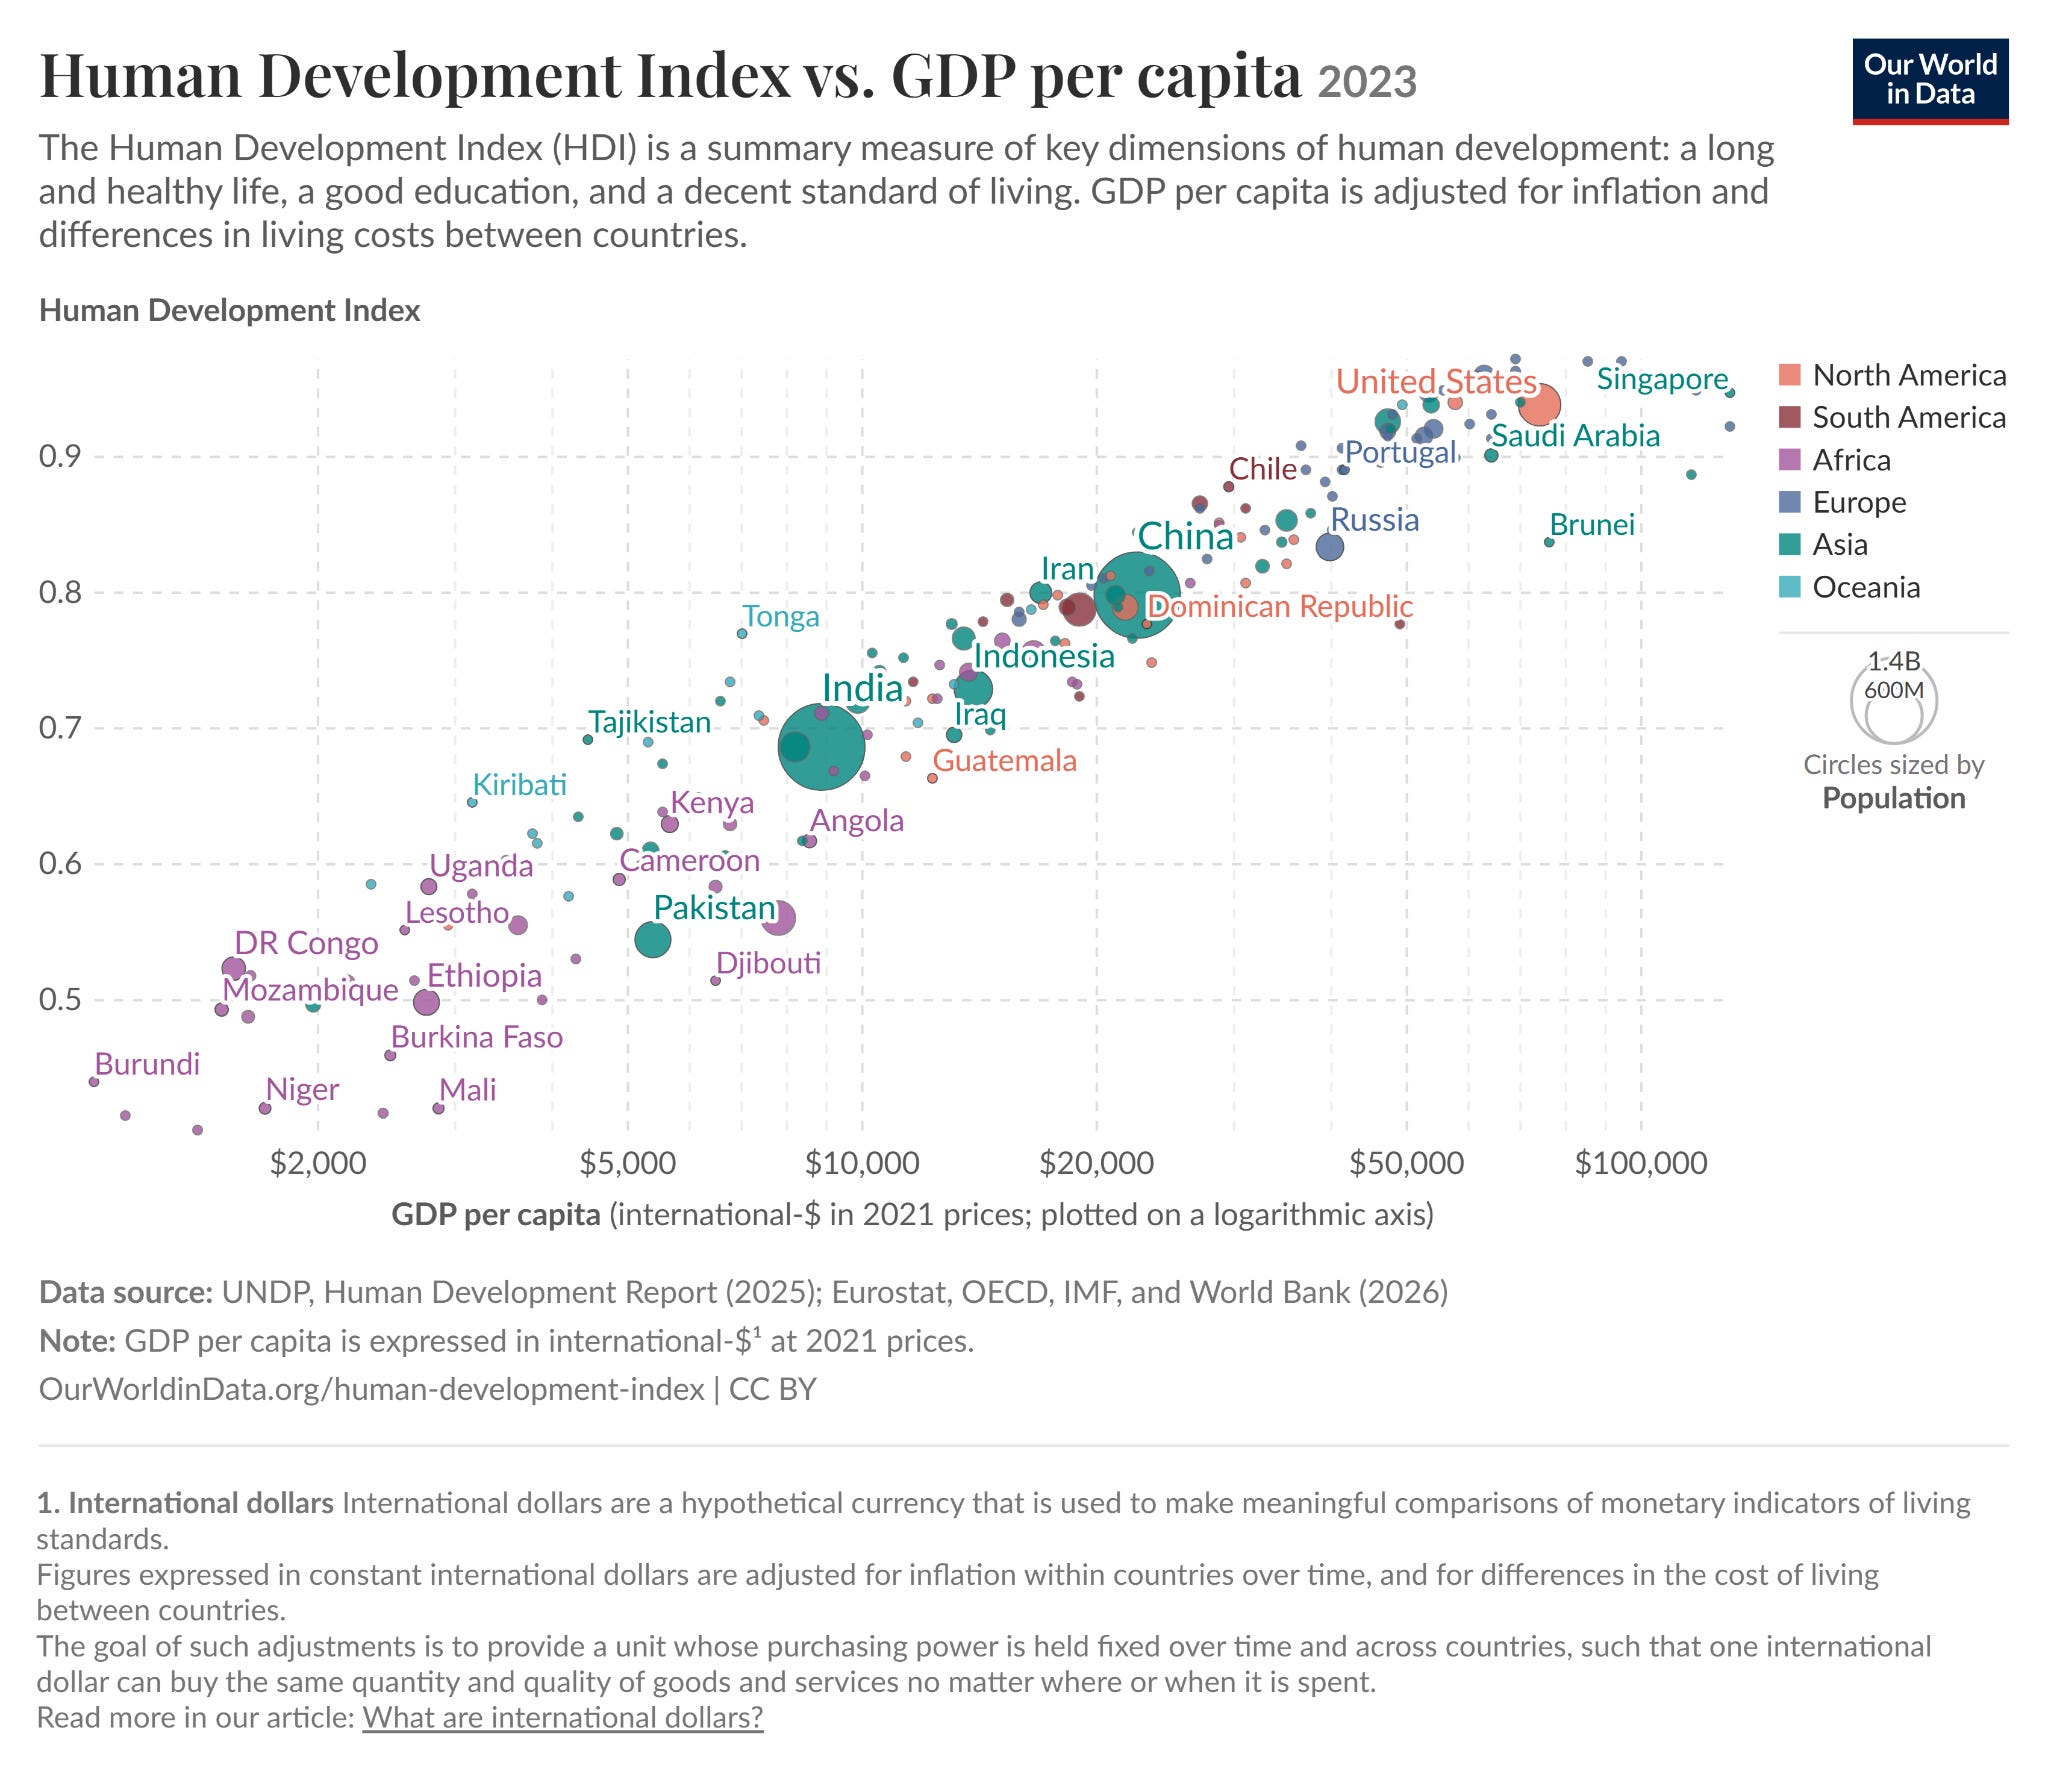
HDI is the UN’s flagship alternative. It combines life expectancy, years of schooling and income per capita into a single score.
Pros: UN-backing gives it institutional heft. It’s also genuinely global and has a history going back to 1990.
Cons: Because a country can score well on average, it can mask serious internal inequality. It also says nothing about the environment, personal freedom or whether people feel like participants in their own society.
Better Life Index
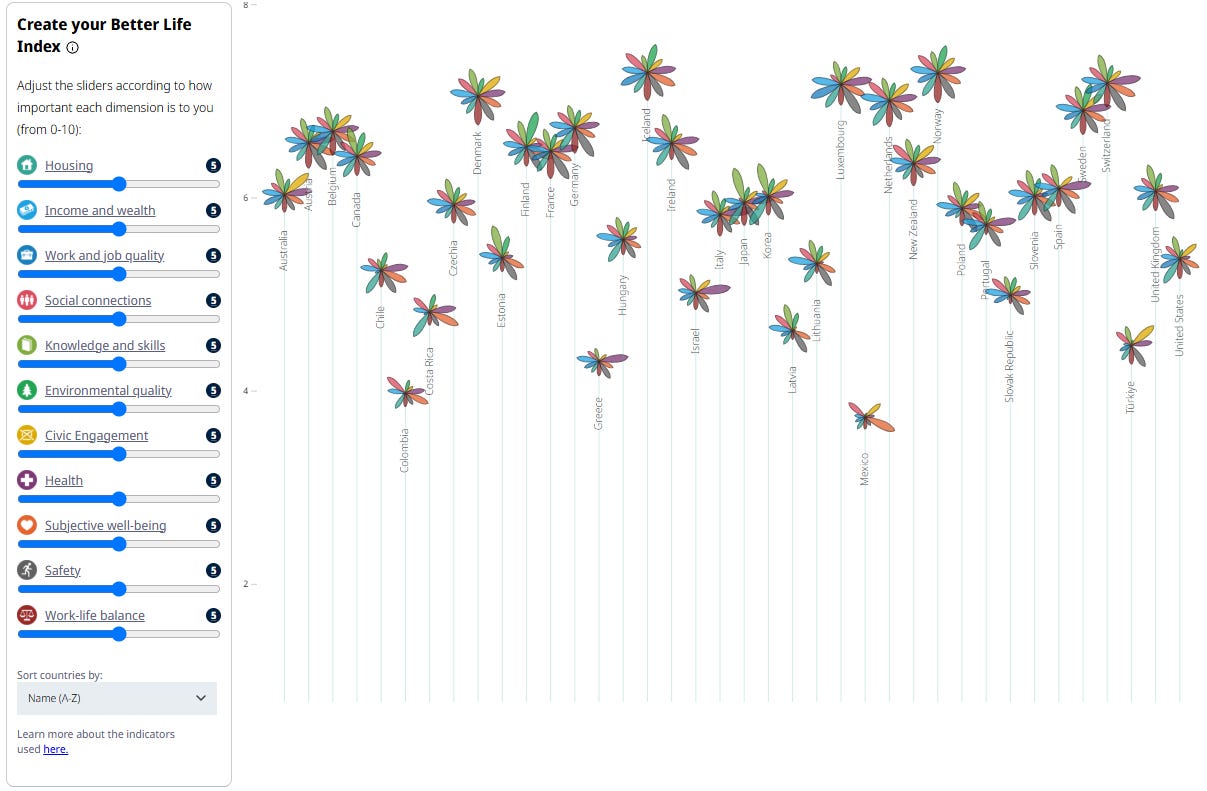
The OECD’s BLI is an interactive, multi-dimensional index covering issues including housing, income, education, civic engagement and health. Distinctively, it lets users adjust the weight of the categories rather than imposing one fixed formula.
Pros: It targets a key deficiency of GDP by showing the degree to which people can actually participate in economic and civic life.
Cons: Because it’s customizable, it resists being reduced to the single, simple number that gives GDP its political power.
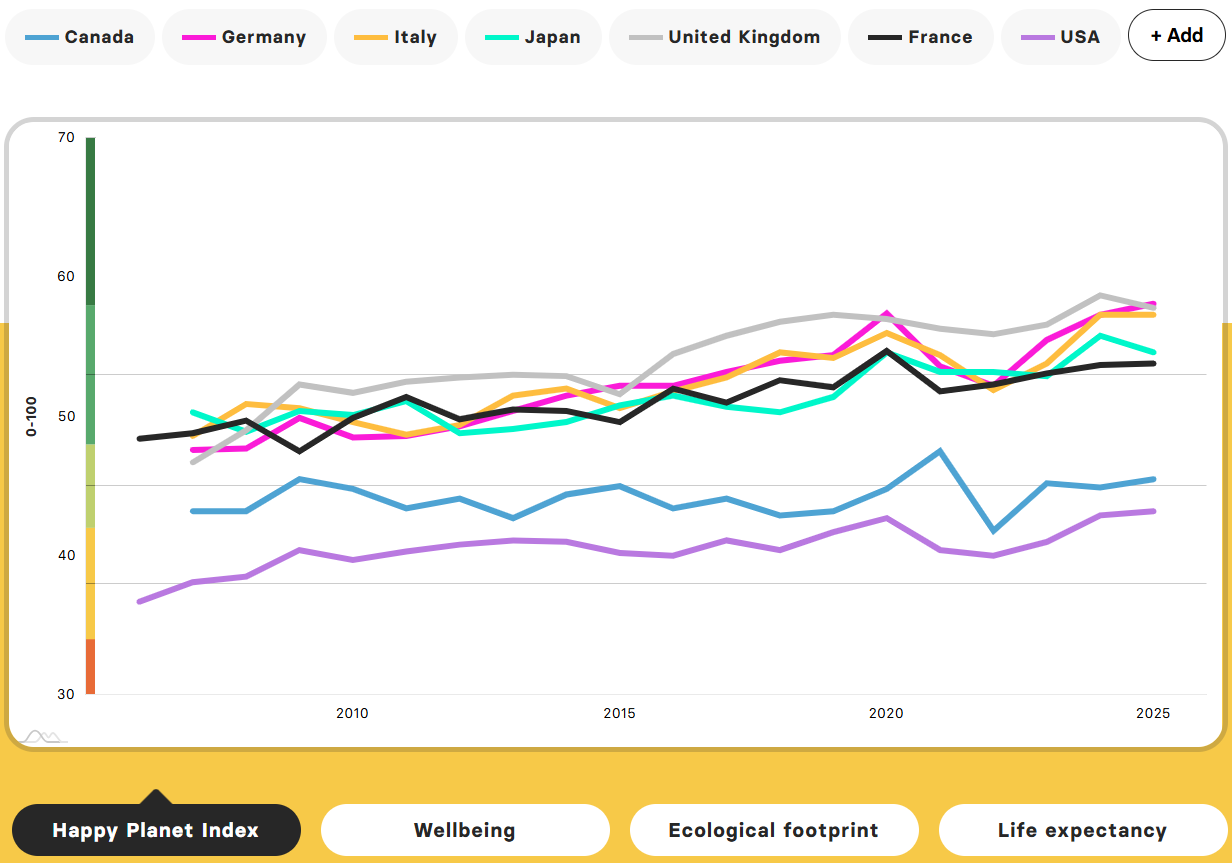
Happy Planet Index
HPI combines wellbeing, life expectancy and ecological footprint to ask which countries deliver long, satisfying lives at the lowest environmental cost.
Pros: It explicitly penalizes growth achieved by burning through the planet’s capacity to sustain human civilization.
Cons: It’s more useful as a critique of consumption-heavy economies than as a governing tool.
Social Progress Index
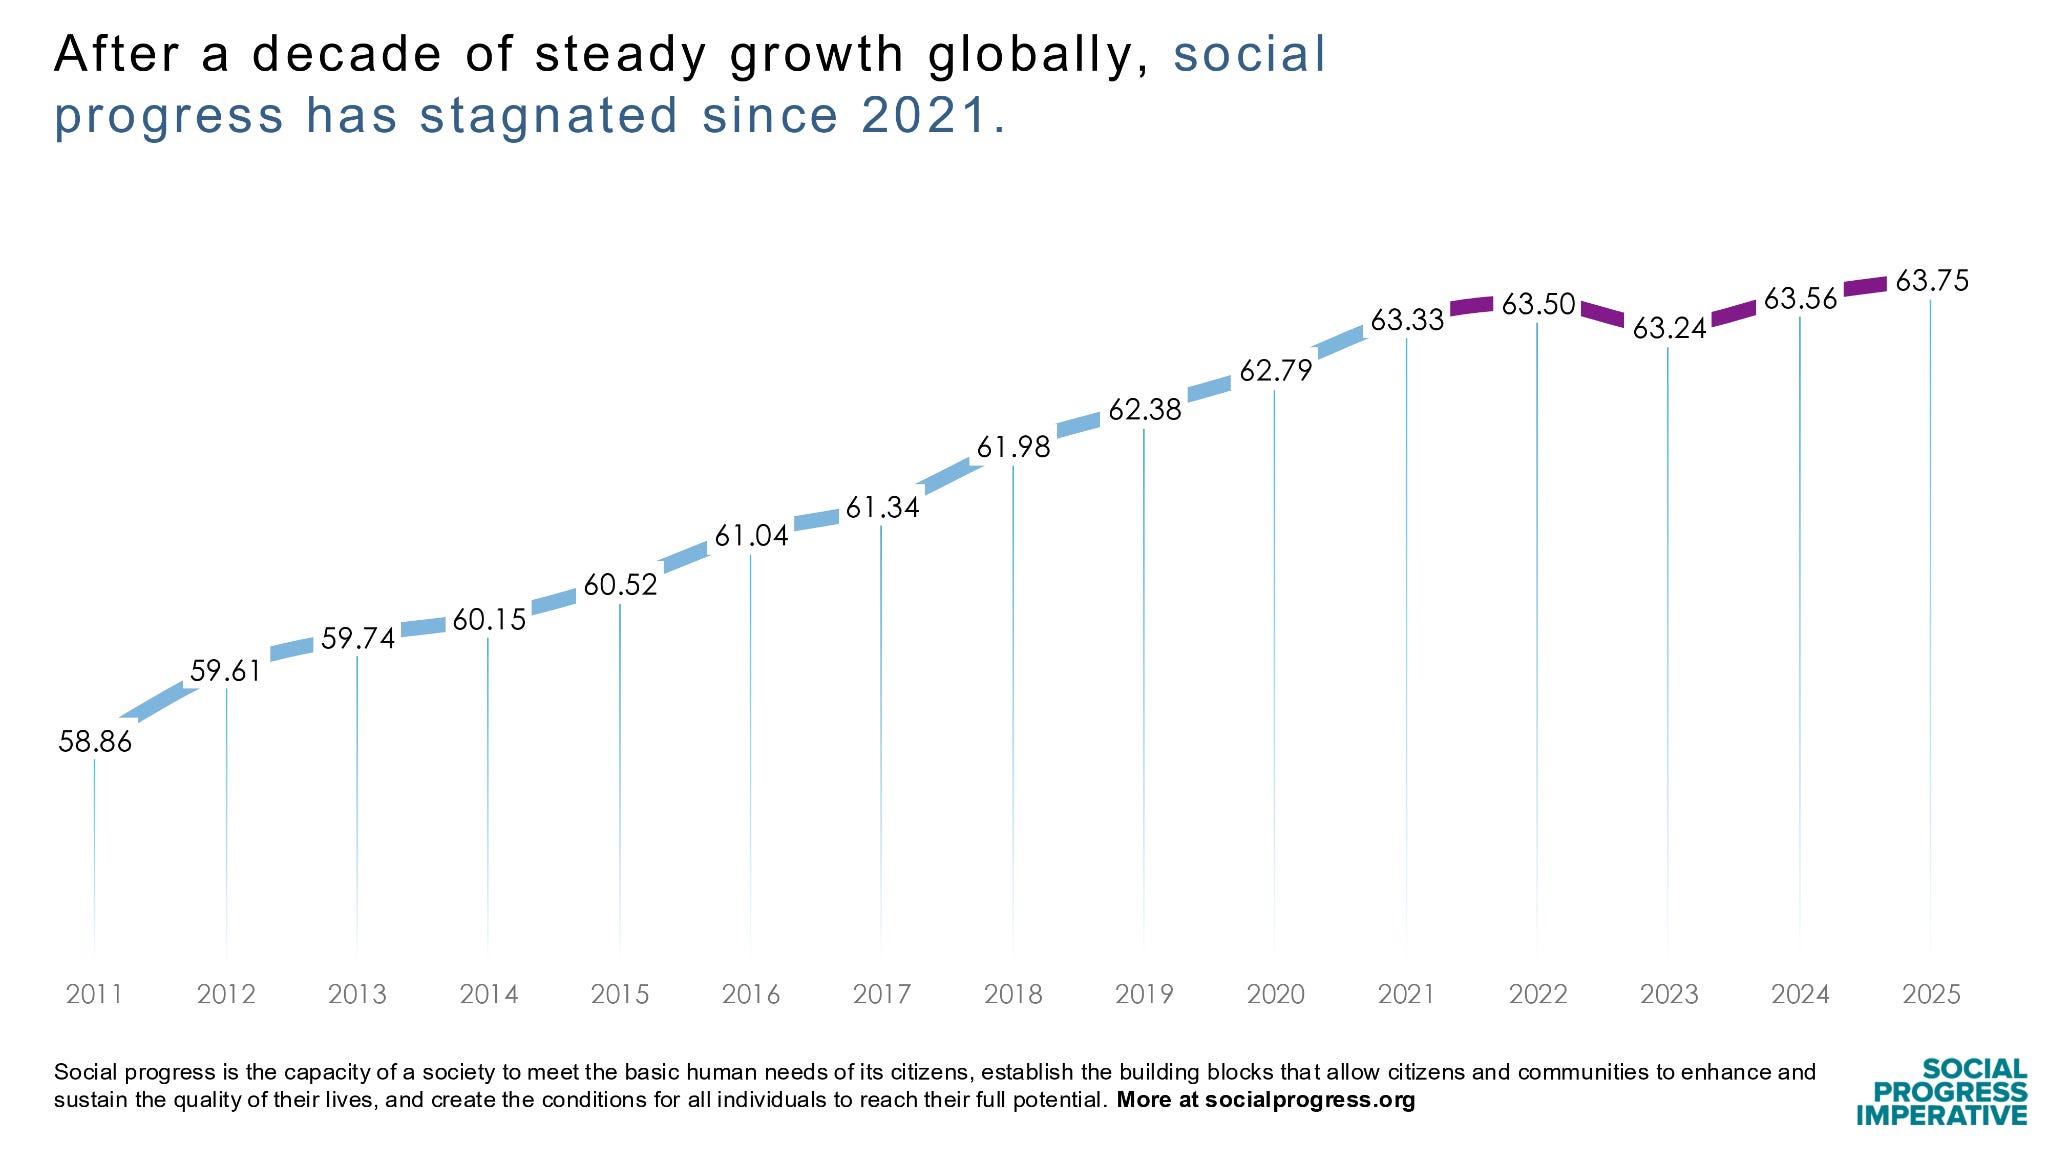
Developed by advocacy group Social Progress Imperative, SPI measures how countries provide basic human needs and create opportunity for their people.
Pros: Since it deliberately ignores economic indicators, it doesn’t try to replace GDP but rather sits alongside it as an additional policy tool.
Cons: There’s a lot of judgement calls in quantifying aspects such as freedom and safety.
Counting What Counts
To pick one alternative, I’d vote for the Genuine Progress Indicator. That’s because it feels closer to what people already know and that makes it more accessible. That familiarity shows in variants being adopted into budgeting processes in U.S. states like Maryland and Vermont, and cities including San Francisco, Cleveland and Baltimore.
Paired with something like New Zealand’s Wellbeing Budget — which forces government agencies to justify spending against goals of reducing poverty, protecting mental health and promoting opportunity — there’s the makings of a toolkit that can improve policy for the majority.
“Growth alone does not lead to a great country,” Prime Minister Jacinda Ardern said at its launch in 2019. “So it’s time to focus on those things that do.”
To be fair, New Zealand’s experience with its budgeting process since then has been mixed, but that shows the scale of the challenge of fixing what took decades to break. It’s an argument for urgency, patience and persistence, rather than sticking with what’s broken.
Thank you, Chris! Very relevant for our Stadtwerte. 🙏